Measuring Stylus Latency
For any app offering stylus input, minimizing latency is critical. Research shows users can perceive dragging delays even in the low milliseconds, and yet most of our software is slow for all sorts of reasons. But before we invest in any tricks to improve our latency, we need to measure it!
Saying I’m a stylus nerd would be an understatement. I’ve been working on stylus products at Google for 8 years. I’ve had the chance to launch low-latency inking on Android and ChromeOS, including public APIs. Over that time I’ve tried lots of approaches for measuring latency. The best approach is actually surprisingly simple, anyone can do it at home without fancy equipment.
Your app may already be measuring key interaction latencies using methods like tracing:
Log.d("TAG", "start: ${System.currentTimeMillis()}")
doSomething()
Log.d("TAG", "end: ${System.currentTimeMillis()}")
However, these methods fall short for stylus because they can’t capture the full latency picture, which includes hardware and operating system delays.
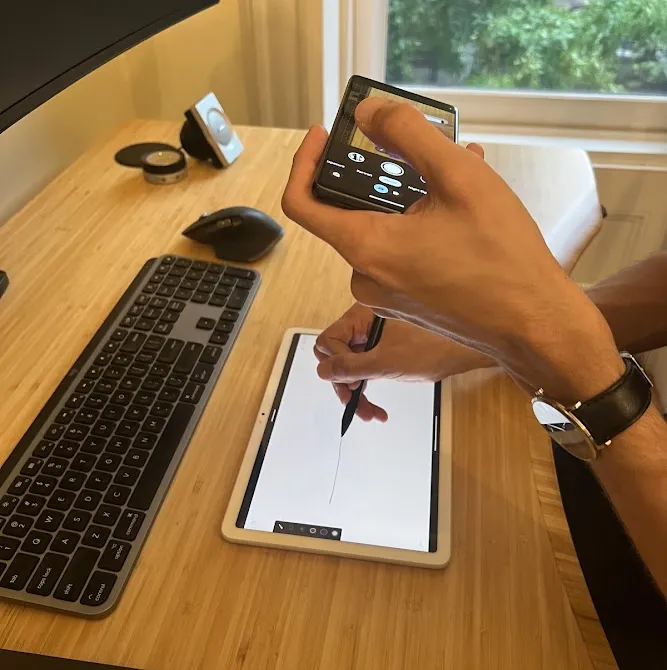
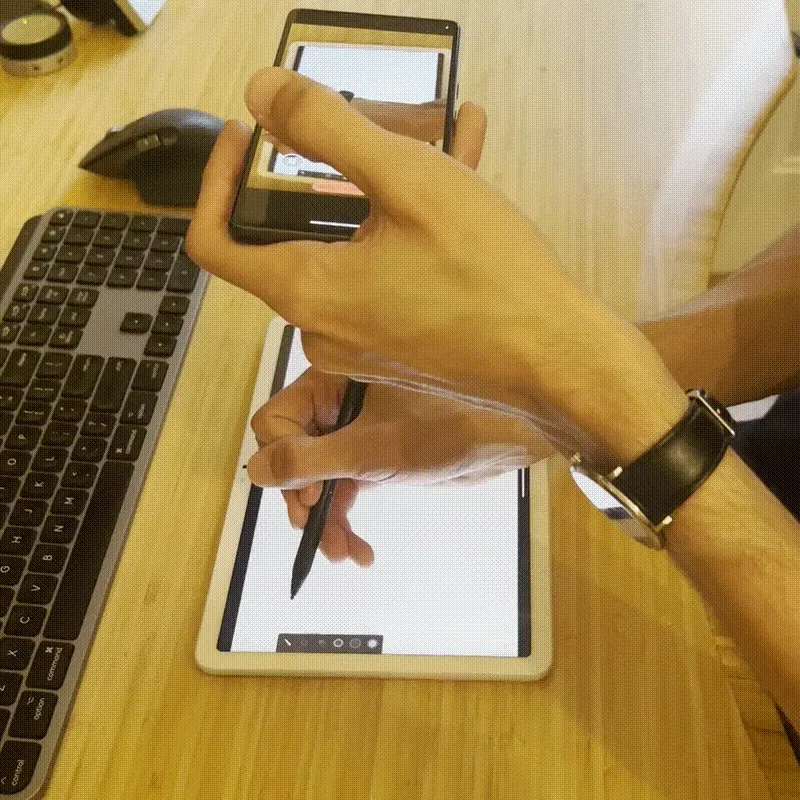
The most comprehensive approach is a slow motion video, letting us see exactly how far the digital ink is lagging behind the actual tip of the stylus. Here’s what one looks like:

Let’s walk through how we can capture one and measure stylus latency.
Setting up
You don’t need any fancy gear to capture this kind of video. I usually just hold my Pixel 7 above my tablet, which gets measurements within 4ms accuracy. A $20 phone tripod for steadiness can add more precision.

Recording
On my Pixel 7, I set the camera to Slow Motion and 1/8x speed (240fps). Once I start recording, I draw a few quick straight lines, slanting my hand to ensure it won’t obscure the tip of the stylus. Don’t worry about being identical, any fast enough stroke works. These notes will simplify our lives when we come to measuring.

Side note: straight lines will be a best case scenario for latency since many stylus apps predict where the stylus is going, and straight lines are an easy case for prediction. I occasionally measure handwriting or zigzags to stress test prediction. But most prediction is good enough that straight lines can be considered representative.
Once I’ve finished recording, I sync the video and download it onto my computer. I use Google photos, but any way to transfer the video file will work.
Measuring
At last, we’re ready to measure! At a high level, we need to figure out how long it takes for ink to catch up with the tip of the stylus. So concretely, we can pick a frame in our video, mark where the tip of the stylus is, then see how long it takes for the ink to reach that point.

But there are 3 challenges we need to deal with first. Unlike pen and paper, digital displays have refresh rates that break up how often they can update. The two most common rates are 60hz displays, which update every 16ms, and 120hz displays, which update every 8ms. This discrete updating means:
- Latency isn’t consistent: Latency varies within a single frame because the stylus keeps moving before the display can update again. I recommend using “frame-end latency,” which captures the worst-case latency during a frame.

- There isn’t a clear starting point: During a single device frame, the digital ink will gradually fade in on the display. For consistency, measure “frame end” as the slow-motion video frame where the line segment is fully opaque, right before the next segment begins to fade in.

- A single frame may skip past the stylus: When a line jumps ahead of your measurement point, estimate the percentage of that frame needed for the ink to reach the target. For example, on a 60hz display 50% of a 16ms frame is 8ms.

Ok, that was a lot! But now we know what we’re measuring: we’re choosing frame-end latency by aligning to when the stroke is fully faded in, and then counting device frames including partial estimates for the last one.
Let’s see what this looks like with a real video. I made a little tool at https://latency.tbuckley.com (GitHub) to help me with the process. You can click to mark the stylus, then use left/right arrows to step through slow-motion video or device frames. The total latency is tracked in the sidebar.
Video players like VLC also work: track the current tip of the stylus (ex. with your finger) and then step through frames until the line reaches your mark (VLC pro tip: press E to step forward by one frame).
Improving
Now that you can measure latency, compare your app’s performance with others. Strive for the lowest latency possible, as research shows users can perceive delays even in the low milliseconds.
On Android, any app can reach ~16ms latency on 60hz displays and ~4ms on 120hz displays. Check out this Android Developers article to learn more about APIs for unbuffered input, bypassing certain rendering processes, and predicting stylus movement. I’d tell you that this is significantly better than what iPadOS offers, but why trust me when you can measure for yourself…
Thanks for reading. Now go make some fast software!